


What's New
Whats New
How to design an effective infographic to share nutrition and scientific information
Did you know? Infographics can be a useful tool to display data and scientific information, and disseminate nutrition knowledge and research findings. They are gaining increasing popularity for use in academic, clinical, public health, and other professional settings to bridge the gap between research/knowledge and public understanding.
The dietitians and nutrition researchers at the Canadian Sugar Institute recognize that developing skills to create clear and effective infographics can be highly useful. So we have developed a two-part video series sharing our knowledge and experience on infographic development and design.
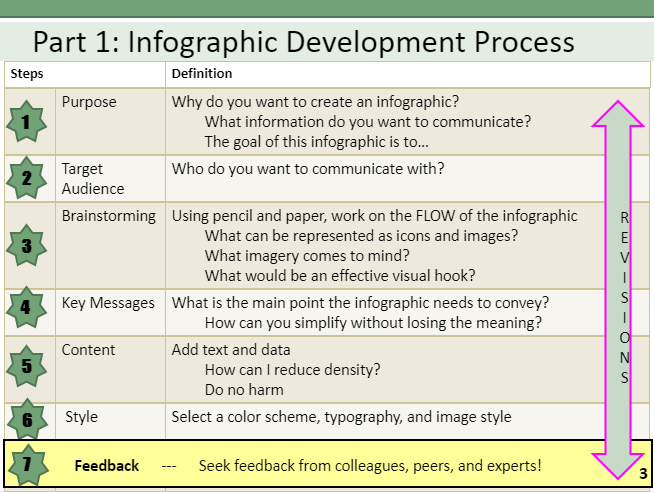
- In Part 1, Dr. Kaitlin Roke (former Associate Manager, Nutrition and Scientific Communications) provides an overview of infographics and infographic design, as well as a process to follow for infographic development.
- In Part 2, Dr. Roke provides a hands-on demonstration of how to create an infographic using Piktochart software.
We hope you gain an appreciation for the value of infographics to communicate nutrition and scientific information, and increased confidence in your ability to use infographic designing tools and software.
A similar workshop was presented in person by Dr. Roke at the 2019 Science Atlantic Inaugural Nutrition and Foods Conference at Mount Saint Vincent University in Halifax, NS. A video recording of this workshop sponsored by the Canadian Nutrition Society is available to guide you through the process.
Infographics related to sugars
The Canadian Sugar Institute has created a series of infographics on a variety of topics related to carbohydrates, sugars, and health. Recent infographics include:
These and other infographics are all available to download or order free of charge.