


What's New
Whats New
Consumer Perceptions of Sugars and Sweeteners: A Summary of Recent Consumer Surveys
Consumer perceptions on sugars and sweeteners may be influenced not only by relevant dietary recommendations and government policy, but also factors such as the characteristics of the food products that contain sugars or sweeteners, personal dietary habits, and the plethora of information they receive from various information outlets in this topic.
Several Canadian and US organizations and independent researchers have conducted consumer-based surveys to obtain a deeper understanding of their overall eating patterns, purchasing decisions, as well as perceptions towards sugars, and sweeteners. These findings can provide some insights into consumer trends related to sugars and sweeteners, but need to be interpreted carefully due to differences in participant characteristics, the year of data collection, and survey methodology between studies.
| Survey Name | 1Tracking Nutrition Trends | 2Canada Food Study | 3Sweeteners and Attitudes Towards Sugar | 4Food and Health Survey | 5Sugar Association 2021 Consumer Survey |
|---|---|---|---|---|---|
| Country | Canada | United States | |||
| Leading Association / Research Group | Canadian Foundation for Dietetic Research | Dr. David Hammon (University of Waterloo) | Mintel | International Food Information Council (IFIC) | US Sugar Association |
| Time Period | 2018 | 2016/2017 | 2016 | 2021 | 2021 |
| Participant Characteristics | 1,500 Canadians aged 18 years and older | 1,000 youth and young Canadians aged 18 to 32 years | 1,700 Canadians aged 18 years and older | 1,014 Americans aged 18 to 80 years | 1,500 Americans aged 18 years and older |
Key observations from these studies are summarized below:
Canadian Surveys
1. The Canadian Foundation of Dietetic Research Tracking Nutrition Trends1 2018 survey conducted among 1,500 Canadian adults aged 18 years and older indicated that,
- Taste is the most important factor when choosing food (95%), followed by nutrition (89%), cost (87%) and convenience or ease of preparation (77%);
- Among Canadians who said their food choices were influenced by sugars, they are most likely to eat foods containing honey (30%) and maple syrup (25%), followed by sugar (14%), fructose (7%), evaporated cane juice (7%), and corn syrup (6%).
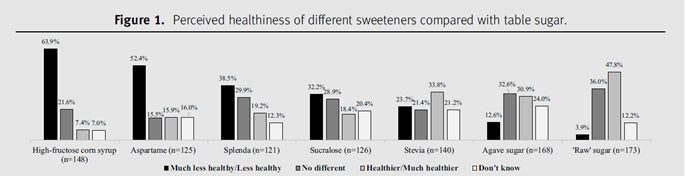
2. The 2021 paper “Perceived Healthiness of Sweeteners among Young Adults in Canada2” published in the Journal of Dietetic Research and Practice presented results from the 2017 Canada Food Study, which collected opinions from 1,000 young adults (aged 18 to 32 years old) in 5 major Canadian cities. Key findings included:
- The majority perceived high-fructose corn syrup (64%) and aspartame (52%) as being less healthy than table sugar;
- Almost half (48%) perceived “raw” sugar as being healthier than table sugar;
- More consumers indicated that they had attempted to reduce their intake of sugars compared to “artificial” or “natural” low-calorie sweeteners.
3. A 2016 Mintel survey3 conducted among 1,700 Canadian adults aged 18 years and older showed that,
- 77% of respondents agreed that it was fine to eat sugar as an occasional treat;
- 45% believed that it is best to avoid food and drinks containing artificial sweeteners;
- Taste (58%) is the most important point of consideration when buying sugars or sugar substitutes, followed by naturalness (58%).
US Surveys
1. The 2021 Food & Health Survey report4 conducted by IFIC collected insights from 1,014 Americans aged 18 to 80 years. Key results include:
- Similar to previous years, purchasing behaviours continued to be driven by taste (82%), price (66%), healthfulness (58%), convenience (52%), and environmental sustainability (31%).
- Two-thirds found it easy to figure out how healthy a product is based on labelling information and about half (52%) indicated that they pay close attention to food labels when shopping, either in-person or online.
- About 25% of respondents indicated that the Total Sugars information on the Nutrition Facts table had the biggest influence on their purchases; 21% said the same about Total Carbohydrates, while only 13% said this about Added Sugars.
- The number of Americans limiting or avoiding sugars in their diet was similar to 2020 (72%), but down from 2019 (80%).
- Of those avoiding or limiting sugars, the top actions taken to do so, were drinking water instead of sweetened beverages, and limiting or avoiding certain foods and beverages in their diet.
- Sugar was still the preferred sweetener by more (28%) Americans compared to low or no-calorie sweeteners (23%).
- Of those who preferred sugar, reasons given were a belief that low/no-calorie sweeteners are not good for you, preference for taste of sugar, and preference of sugar’s sweetness.
- Of those respondents who indicated a preference for low or no-calorie sweeteners, the top perceived benefits included helping them to consume less sugar, managing diabetes, and maintaining weight.
2. The 2021 US Sugar Association Consumer Survey5 asked 1,500 US consumers aged 18 years and older about their understanding of, and feelings towards sugar and sweeteners. Key observations include:
- Sugar topped the list of ingredients that people said makes food and beverages enjoyable to eat or drink.
- Nearly 3 in 4 consumers monitored their intake of sugar or added sugars. When presented with four approaches to reducing sugar or added sugars intake, choosing to consume the regular product less often was the most popular among survey participants.
- HFCS (42%) and artificial sweeteners (39%) topped the list of ingredients consumers tried to avoid. Compared to 2018, sugar moved from number 1 to number 8 (27%) on this list.
- More than 70% of respondents said it was a priority to avoid artificial sweeteners in yogurt, canned fruit, peanut butter, and bread; 82% would avoid them in children’s cereals.