


What's New
Whats New
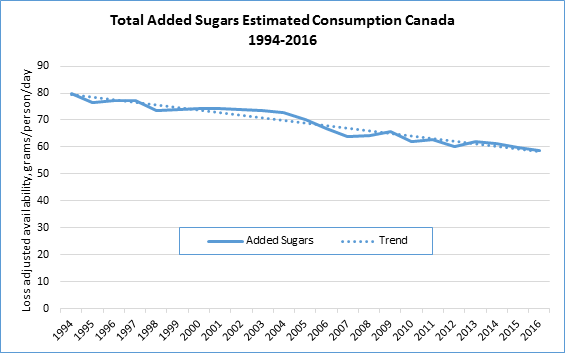
How much sugars do Canadians consume?
Last week, Statistics Canada released the loss-adjusted food availability data for 2016 (CANSIM). Loss adjusted availability data, a proxy for consumption of added sugars, continues to decline, with a 26% per capita reduction of added sugars over the past 20 years. While availability data may not accurately reflect what Canadians consume, the trend towards a reduced availability of added sugars is promising.
The best estimate of actual food consumption is the Canadian Community Health Survey (CCHS) data. The most recent dietary intake information currently available comes from CCHS 2004, which reported the average intake of total sugars to be 110 grams/day (21% of energy). From this information, the average consumption of added sugars was estimated to be 51 grams/day (11% of energy).
Health professionals and interested organizations eagerly await the release of the next iteration of CCHS dietary survey data collected in 2015, for more current information on sugars, as well as the ability to assess trends and changes in eating habits, food consumption, nutrition and health since 2004.
We can also consult trends in dietary intakes from other countries that share similarities with Canada, such as Australia. For example, this recent paper showed a similar declining trend in added sugars using availability data:
Declining consumption of added sugars and sugar-sweetened beverages in Australia: a challenge for obesity prevention
Brand-Miller J.C. & Barclay A.W. Am J Clin Nutr, first published online March 8, 2017 doi:10.3945/ajcn.116.145318
Abstract
Background: Reduced intakes of added sugars and sugar-sweetened beverages (SSBs) have been the main focus of efforts to stall obesity. Although obesity has risen steeply in Australia, some evidence suggests that added-sugars and SSB intakes have declined over the same time frame.
Objective: We investigated recent trends in the availability of sugars and sweeteners and changes in intakes of total sugars, added sugars, and SSBs in Australia by using multiple, independent data sources.
Design: The study was designed to compare relevant data published by the Food and Agriculture Organization of the United Nations [FAO Statistics Division Database (FAOSTAT)], the Australian government, academia, and the food industry.
Results: With the use of the FAOSTAT food balance sheets for Australia, the per capita availability of added or refined sugars and sweeteners was shown to have fallen 16% from 152 g/d in 1980 to 127 g/d in 2011 (P-trend = 0.001). In national dietary surveys in 1995 and 2011–2012, added-sugars intake declined markedly in adult men (from 72 to 59 g/d; −18%) but not in women (44–42 g/d; NS). As a proportion of total energy, added-sugars intake fell 10% in adult men but nonsignificantly in adult women. Between 1995 and 2011–2012, the proportion of energy from SSBs (including 100% juice) declined 10% in adult men and 20% in women. More marked changes were observed in children aged 2–18 y. Data from national grocery sales indicated that per capita added-sugars intakes derived from carbonated soft drinks fell 26% between 1997 and 2011 (from 23 to 17 g/d) with similar trends for noncarbonated beverages.
Conclusions: In Australia, 4 independent data sets confirmed shorter- and longer-term declines in the availability and intake of added sugars, including those contributed by SSBs. The findings challenge the widespread belief that energy from added sugars or sugars in solution are uniquely linked to the prevalence of obesity.